Security Analytics in Databricks: From Login Events to a Suspicious Login Pattern
September 26, 2026
I wanted to understand how Databricks fits into a security data workflow, so I built a small authentication investigation using synthetic events. The goal was straightforward: generate login activity, turn it into a consistent dataset, identify repeated failures followed by a success, and visualize the activity over time.
The most useful lesson came from the detection query. Counting failures and successes together was easy. Proving that the failures happened before the success required more careful logic.
The lab
I used a Databricks notebook with four cells. A cell is an individual block of code that can run separately and display its output underneath it.
| Cell | Language | Purpose |
|---|---|---|
| 1 | Python | Generate synthetic events and write a raw Delta table |
| 2 | SQL | Normalize fields and create a cleaned table |
| 3 | SQL | Find successful logins preceded by repeated failures |
| 4 | SQL | Summarize activity by hour for a visualization |
Databricks Free Edition provides a serverless environment for learning, subject to usage quotas and feature limits. That kept the setup small enough for a weekend exercise.
Building a dataset with a known answer
I generated 500 baseline events with Python, rotating through sample users and source IP addresses. Most events were successful logins, with a failure every ninth event.
I then added a deliberate sequence for the admin account:
- Twelve failed logins from
203.0.113.9, one minute apart, starting at 10:00. - One successful login from the same IP at 10:13.
The dataset contains 513 events: 68 failures and 445 successes. All identities and events are synthetic, and the IP addresses come from ranges reserved for documentation. The timestamps represent September 1, 2026, in the sample data; they are not the date of a real incident.
I converted the generated rows to a Spark DataFrame and wrote them to a Delta table:
df = spark.createDataFrame(
    rows, ["event_time", "user_id", "source_ip", "status"]
)

df.write.mode("overwrite").format("delta").saveAsTable(
    "default.raw_auth_events"
)
This is the final portion of the generator, with rows containing the synthetic events. Overwriting the table makes rerunning the lab repeatable. A production ingestion process would need a deliberate approach to appending events, handling duplicates, and retaining history.
Creating a consistent analysis table
I kept the raw table and created a separate table for analysis:
CREATE OR REPLACE TABLE default.auth_events AS
SELECT
  event_time,
  lower(trim(user_id)) AS user_id,
  source_ip,
  upper(status) AS outcome,
  DATE(event_time) AS event_date
FROM default.raw_auth_events;
This standardizes usernames and outcomes and adds a date field for analysis. The generated data is already tidy, so this demonstrates a normalization step rather than a complete data-quality pipeline. Real authentication logs would also need checks for missing fields, malformed timestamps, duplicate events, and inconsistent identity formats.
The default prefix identifies the schema inside the notebook's current catalog. In a larger environment, I would use explicit catalog, schema, and table names to make the target unambiguous.
The gotcha: counts do not establish a sequence
The initial query grouped events by user and source IP, then looked for at least ten failures and one success. That establishes that both outcomes occurred. It does not establish their order.
A successful login in the morning and failed attempts later that day could satisfy that rule. To answer the actual investigation question, I revised the query to anchor each candidate on a successful login and look backward 15 minutes:
SELECT
  s.user_id,
  s.source_ip,
  s.event_time AS successful_login,
  COUNT(*) AS failures_before_success
FROM default.auth_events AS s
JOIN default.auth_events AS f
  ON s.user_id = f.user_id
 AND s.source_ip = f.source_ip
 AND f.outcome = 'FAILURE'
 AND f.event_time >= s.event_time - INTERVAL 15 MINUTES
 AND f.event_time < s.event_time
WHERE s.outcome = 'SUCCESS'
GROUP BY s.user_id, s.source_ip, s.event_time
HAVING COUNT(*) >= 10;
Both aliases refer to the same table. s selects successful events, while f finds earlier failures for the same user and IP. The time conditions include failures within the preceding 15 minutes and exclude events at or after the success.
For the injected sequence, the expected result is:
| User | Source IP | Successful login | Failures in preceding 15 minutes |
|---|---|---|---|
| admin | 203.0.113.9 | 2026-09-01 10:13:00 | 12 |
The threshold and time window are lab choices. Their usefulness in a real environment would depend on normal authentication behavior and the cost of false positives.
Visualizing the activity
I added a fourth cell to summarize the events by hour:
SELECT
  DATE_TRUNC('HOUR', event_time) AS hour,
  COUNT_IF(outcome = 'FAILURE') AS failures,
  COUNT_IF(outcome = 'SUCCESS') AS successes
FROM default.auth_events
GROUP BY 1
ORDER BY 1;
I used the results to create a bar chart with the hour on the horizontal axis and failures and successes as the two series. The synthetic 10:00 hour contains 12 failures and one success.
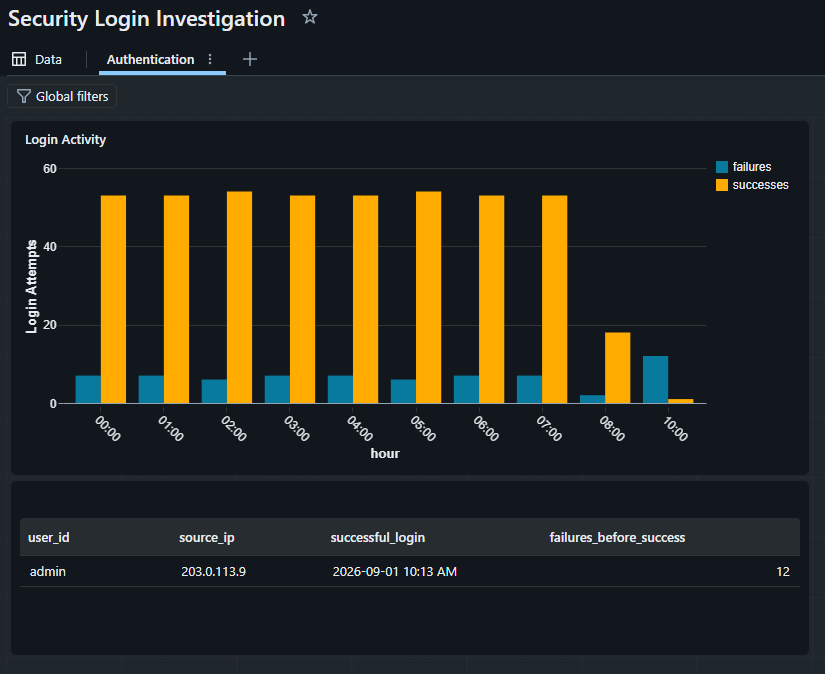
The chart summarizes volume over time. The detection query provides the user, IP, and event-order evidence needed to investigate a particular sequence. Hourly totals alone cannot establish that relationship.
What the finding actually tells me
Repeated failures followed by a success are a reason to investigate. They could reflect password guessing, a user resolving a password problem, or an application retrying stale credentials.
My next investigative questions would be:
- Was the source IP expected for that user?
- Was MFA required, and what happened during the challenge?
- Was the device recognized?
- What did the successful session access or change?
- Were other accounts targeted from the same source?
There are also limits to this detection. It matches one user and one IP, so it can miss attempts distributed across addresses. Duplicate source events could inflate the count, and multiple successes at the same timestamp would need unique event identifiers to distinguish them reliably. This exercise establishes the query mechanics; measuring detection quality would require more varied test cases.
Where governance fits
The lab also gives me a concrete way to explore Unity Catalog, Databricks' governance layer for data and AI. The raw and cleaned tables provide a useful starting point for inspecting lineage, ownership, and permissions.
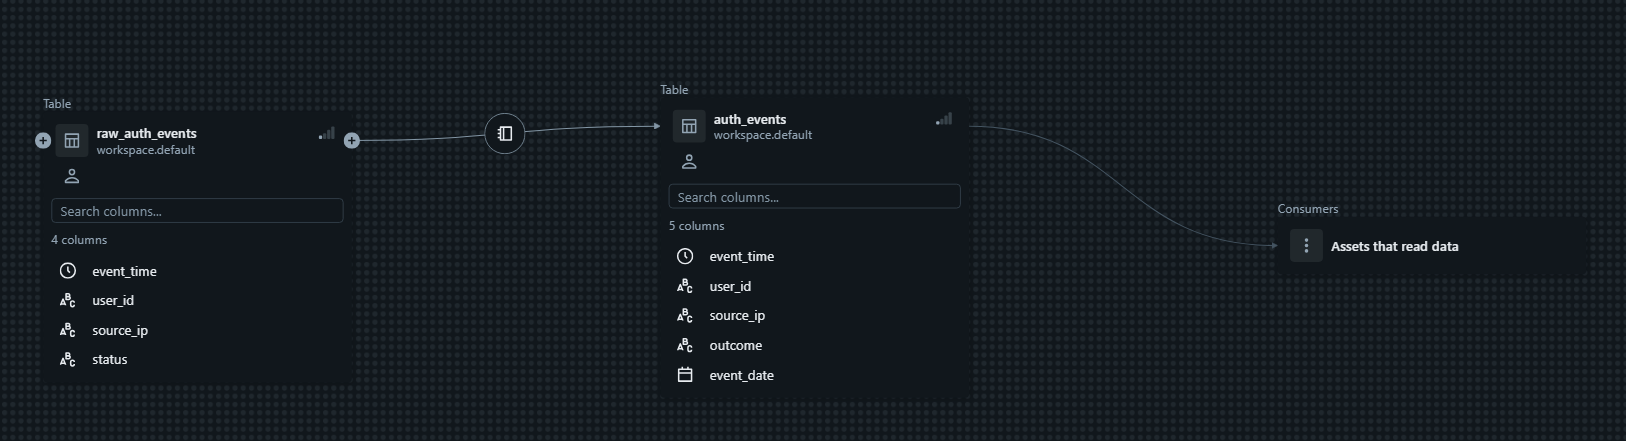
For a production design, I would define who can read raw authentication data, who can modify transformations, and who can access investigation outputs. Lineage helps explain where a result came from; access controls determine who is allowed to use the underlying data. Inspecting those capabilities is the next governance exercise for this project.
What I would build next
- Add negative cases, including a success before the failures and failures outside the time window, to validate the rule.
- Add event IDs, duplicate handling, and explicit timezone normalization.
- Assemble the chart and finding table into a reusable dashboard.
- Ingest a sanitized authentication-log export and compare its schema with the synthetic dataset.
- Add synthetic AI application activity and investigate whether a suspicious login was followed by access to sensitive AI workflows.
This project gave me a practical starting point with notebooks, Spark DataFrames, Delta tables, SQL transformations, and visualization. The lesson I will carry forward is that a detection query needs to express the behavior precisely. If the question includes "followed by," the query needs to enforce that sequence.