Building a Wazuh SIEM/EDR From Scratch
February 10, 2026
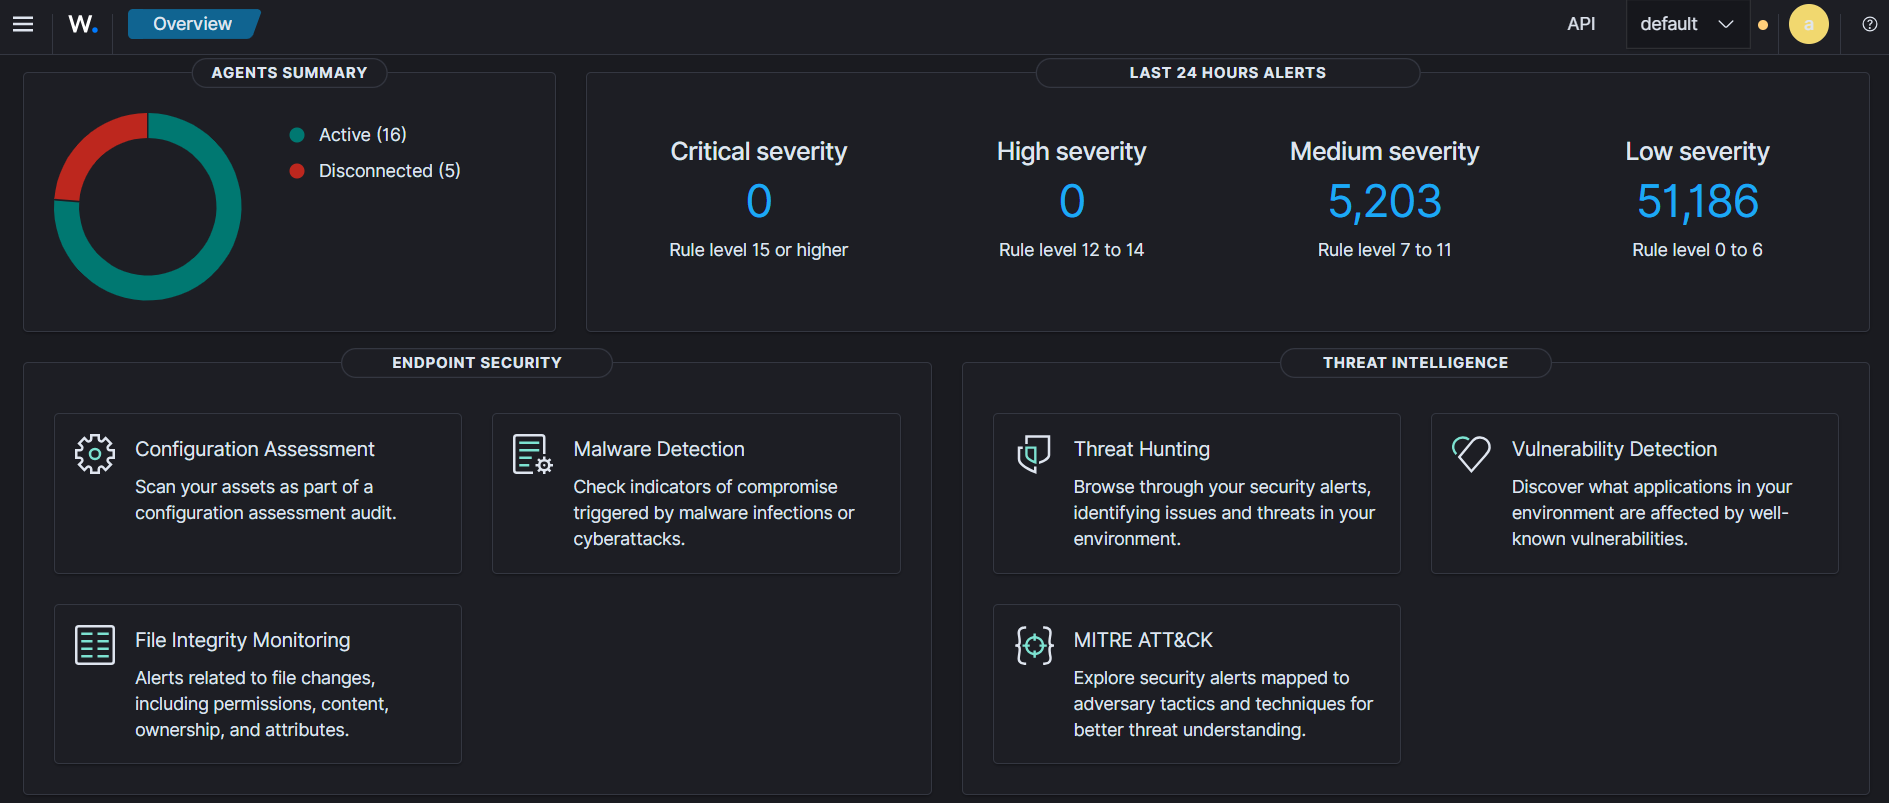
Wazuh is the detection backbone of the lab. Every host, every VLAN, and a few application logs funnel into it, get decoded, matched against rules, and, for a small set of high-confidence detections, trigger an automated firewall block. This is the long version of how it was built, why it's wired the way it is, and the tuning that turned it from "alert firehose" into something I actually trust.
Why Wazuh over the alternatives
I evaluated three options for the lab's detection layer:
- Full ELK + Elastic Security: powerful, but heavy to run and the detection rules I wanted sit behind a license tier.
- Security Onion: excellent, but it's an appliance-shaped distro; I wanted something I could compose into the existing Docker hosts rather than a dedicated box.
- Wazuh: agent-based host telemetry (the OSSEC lineage), FIM, an EDR-ish active-response module, and its own indexer/dashboard. Open source top to bottom.
Wazuh won because it gives me host-level EDR behavior and SIEM log correlation in one agent, and because active response lets detections do something, not just draw a graph.
Architecture
Three server components, run as containers on a Docker host and fronted by the lab's Kemp load balancer for TLS offload:
                       ┌───────────────────────────┐
   agents (TLS/1514)   │  wazuh-manager            │
   ───────────────────▶│   • analysisd (rules)     │
                       │   • active-response       │──▶ pfSense API (block)
                       └────────────┬──────────────┘
                                    │ (filebeat)
                       ┌────────────▼──────────────┐
                       │  wazuh-indexer            │  ← OpenSearch-compatible store
                       └────────────┬──────────────┘
                       ┌────────────▼──────────────┐
                       │  wazuh-dashboard (HTTPS)  │  ← behind Kemp
                       └───────────────────────────┘
Agents are deployed to every Linux host and report to the manager over TLS on 1514. The manager runs analysisd (the rule engine) and the active-response module; the indexer is the OpenSearch-compatible store; the dashboard is the UI, published only through the Kemp VIP so nothing talks to it directly.
Deployment notes
I run the official wazuh-docker single-node compose stack, pinned to a fixed version tag rather than latest so an unattended pull can't swap the indexer out from under me:
# docker-compose.yml (excerpt)
services:
  wazuh.manager:
    image: wazuh/wazuh-manager:4.9.0
    ulimits:
      memlock: { soft: -1, hard: -1 }
    volumes:
      - wazuh_etc:/var/ossec/etc
      - wazuh_logs:/var/ossec/logs
    ports:
      - "1514:1514/tcp"   # agent enrollment / events
      - "1515:1515/tcp"   # authd enrollment
  wazuh.indexer:
    image: wazuh/wazuh-indexer:4.9.0
    ulimits:
      memlock: { soft: -1, hard: -1 }
      nofile: { soft: 65536, hard: 65536 }
Gotcha #1: `vm.max_map_count`. The indexer is OpenSearch under the hood and will refuse to start until the host is set tovm.max_map_count=262144. Put it in/etc/sysctl.conf, not just a livesysctl -w, or the next reboot silently kills your indexer and you'll spend twenty minutes blaming the container.
Agent enrollment at lab scale
Manually registering agents doesn't scale past about three hosts before it's tedious. I use agent-auth against the manager's authd service with a shared enrollment password, baked into the host provisioning:
# on each new agent
/var/ossec/bin/agent-auth -m wazuh.manager -P "$ENROLL_PASSWORD"
sed -i "s|MANAGER_IP|wazuh.manager|" /var/ossec/etc/ossec.conf
systemctl restart wazuh-agent
Groups matter here: I bucket agents into linux-servers, dmz, and honeypots so each group gets a tailored agent.conf : the honeypot group, for example, gets far more aggressive logging because any activity there is interesting.
Detection engineering: the part that actually matters
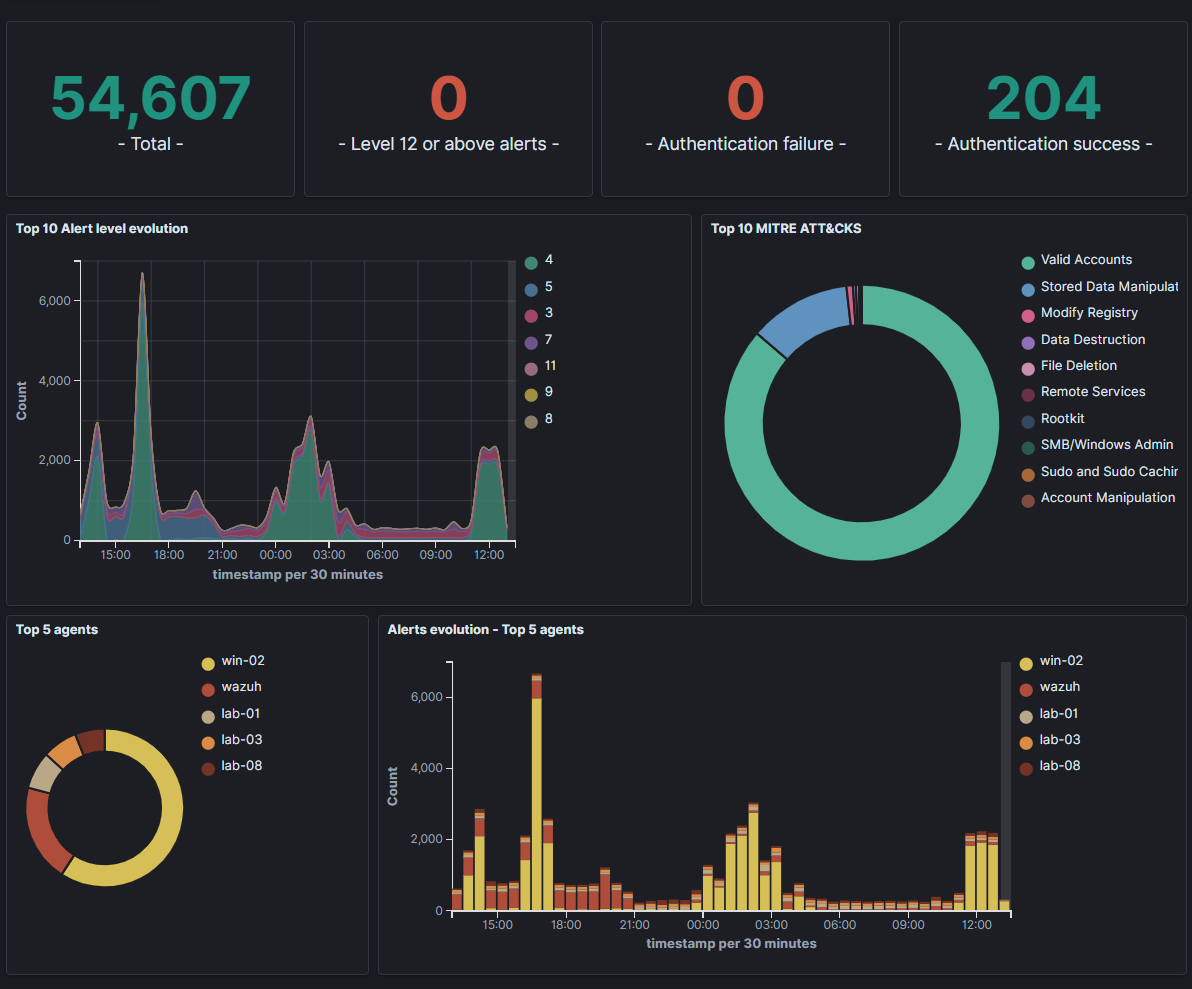
Out of the box Wazuh is chatty. The value is entirely in tuning. My workflow:
1. Baseline, then suppress the known-good
For the first week I let it run and watched what fired. Cron jobs, backup agents, and the vuln scanner (Tenable/Nessus hitting every host) generated most of the noise. I wrote suppression rules rather than disabling whole rule groups (surgical, not blunt):
<!-- local_rules.xml : silence the scanner's auth probes from the known scanner IP -->
<rule id="100010" level="0">
  <if_sid>5710</if_sid>            <!-- sshd: failed/invalid login -->
  <srcip>10.20.30.5</srcip>       <!-- Nessus scanner -->
  <description>Suppressed: known vulnerability scanner auth probe</description>
</rule>
Level 0 means "decode and store, but don't alert." I keep the event for context; I just don't get paged for it.
2. Author rules mapped to real behavior
The rules I actually care about map to attacker techniques, not log lines. Example: escalate immediately on any OpenCanary honeypot interaction, because a canary has no legitimate reason to be touched:
<rule id="100200" level="12">
  <decoded_as>json</decoded_as>
  <field name="logtype">opencanary</field>
  <description>Honeypot interaction: $(src_host) hit canary service $(dst_port)</description>
  <mitre>
    <id>T1046</id>   <!-- Network Service Discovery -->
  </mitre>
</rule>
And a correlation rule for lateral-movement-shaped auth failures: the same source failing against multiple destinations in a short window, which single-host brute-force rules miss:
<rule id="100210" level="10" frequency="8" timeframe="120">
  <if_matched_sid>5710</if_matched_sid>
  <same_source_ip />
  <different_field>dstip</different_field>
  <description>Possible lateral movement: one source, repeated auth failures across hosts</description>
  <mitre><id>T1021</id></mitre>
</rule>
3. Map everything to ATT&CK
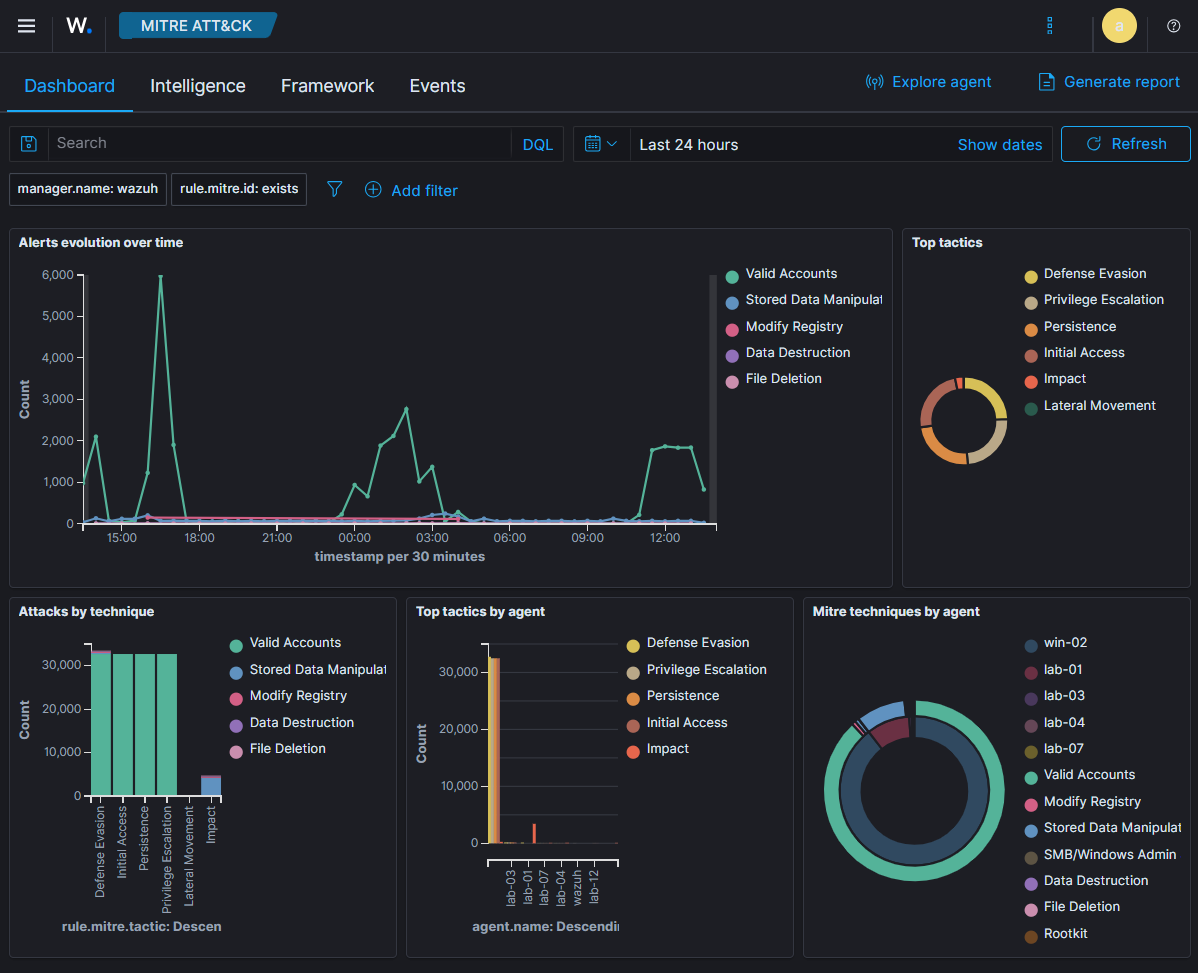
Every custom rule carries a <mitre> tag. This isn't decoration: the dashboard's ATT&CK view becomes a live coverage map, and triage gets faster because the technique is right there in the alert instead of something I have to infer at 2am.
File Integrity Monitoring
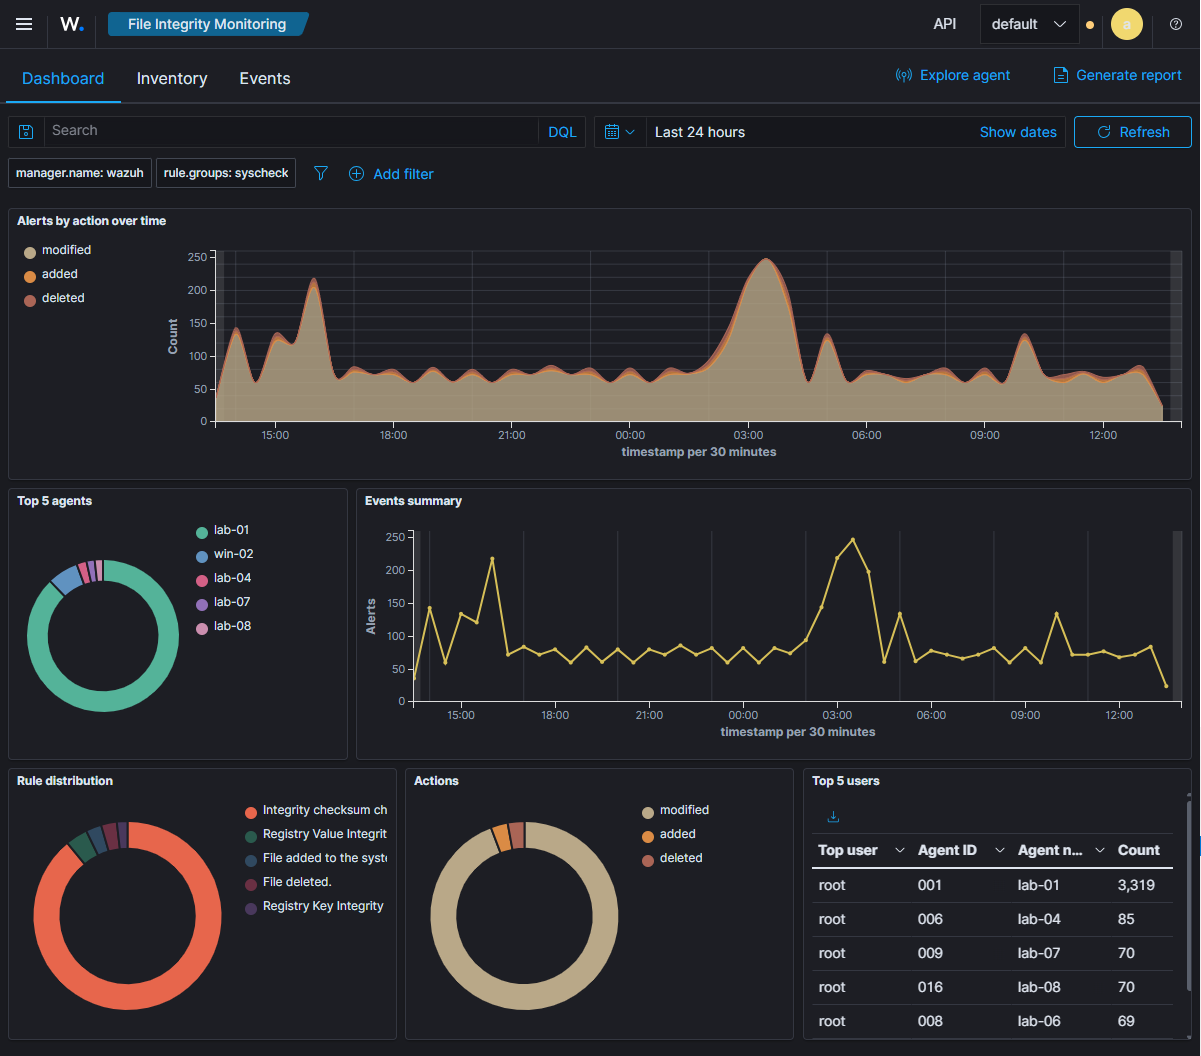
FIM (syscheck) watches the paths that shouldn't change without me knowing: web roots, SSH configs, cron directories, and the container bind-mounts:
<syscheck>
  <directories check_all="yes" realtime="yes">/etc,/usr/bin,/usr/sbin</directories>
  <directories check_all="yes" realtime="yes">/var/www,/root/.ssh</directories>
  <ignore>/etc/mtab</ignore>
  <ignore type="sregex">.log$|.tmp$</ignore>
</syscheck>
Gotcha #2: realtime FIM is inotify-bound.realtime="yes"consumes inotify watches, and a busy directory tree will blow past the defaultfs.inotify.max_user_watches. Bump it, or realtime silently degrades to scheduled scans and you lose the "instant" you thought you had.
Automated response: the EDR half
For a small, deliberately conservative set of detections, Wazuh does more than alert. The active-response module calls a custom script that hits the pfSense API to drop the source into a blocklist alias:
<command>
  <name>pf-block</name>
  <executable>pf-block.sh</executable>
  <timeout_allowed>yes</timeout_allowed>
</command>
<active-response>
  <command>pf-block</command>
  <location>local</location>
  <rules_id>100200,100210</rules_id>   <!-- honeypot hit + lateral movement only -->
  <timeout>3600</timeout>
</active-response>
The script adds the IP to a pfSense firewall alias via the API and Wazuh removes it after the timeout. I deliberately scope active response to only the two highest-confidence rules: a false positive here means I get locked out of a box.
Gotcha #3: test active response in audit mode first. My first version had the lateral-movement rule slightly too loose, and a backup job authenticating across hosts tripped it. Active response cheerfully firewalled my backup server. Now every new AR rule runs with the block logged but not executed for a week before it goes live.
Feeding MISP indicators in
The lab's MISP feed exports IOCs that Wazuh matches against in real time using CDB lists. A cron job pulls fresh malicious IPs and domains from MISP into a CDB list the manager reloads:
<rule id="100300" level="11">
  <if_sid>5710,86601</if_sid>
  <list field="srcip" lookup="address_match_key">etc/lists/misp-malicious-ips</list>
  <description>Connection from MISP-flagged malicious IP: $(srcip)</description>
</rule>
This closes the loop: intel collected by one lab service becomes a detection in another, with no manual copy-paste.
Vulnerability detection
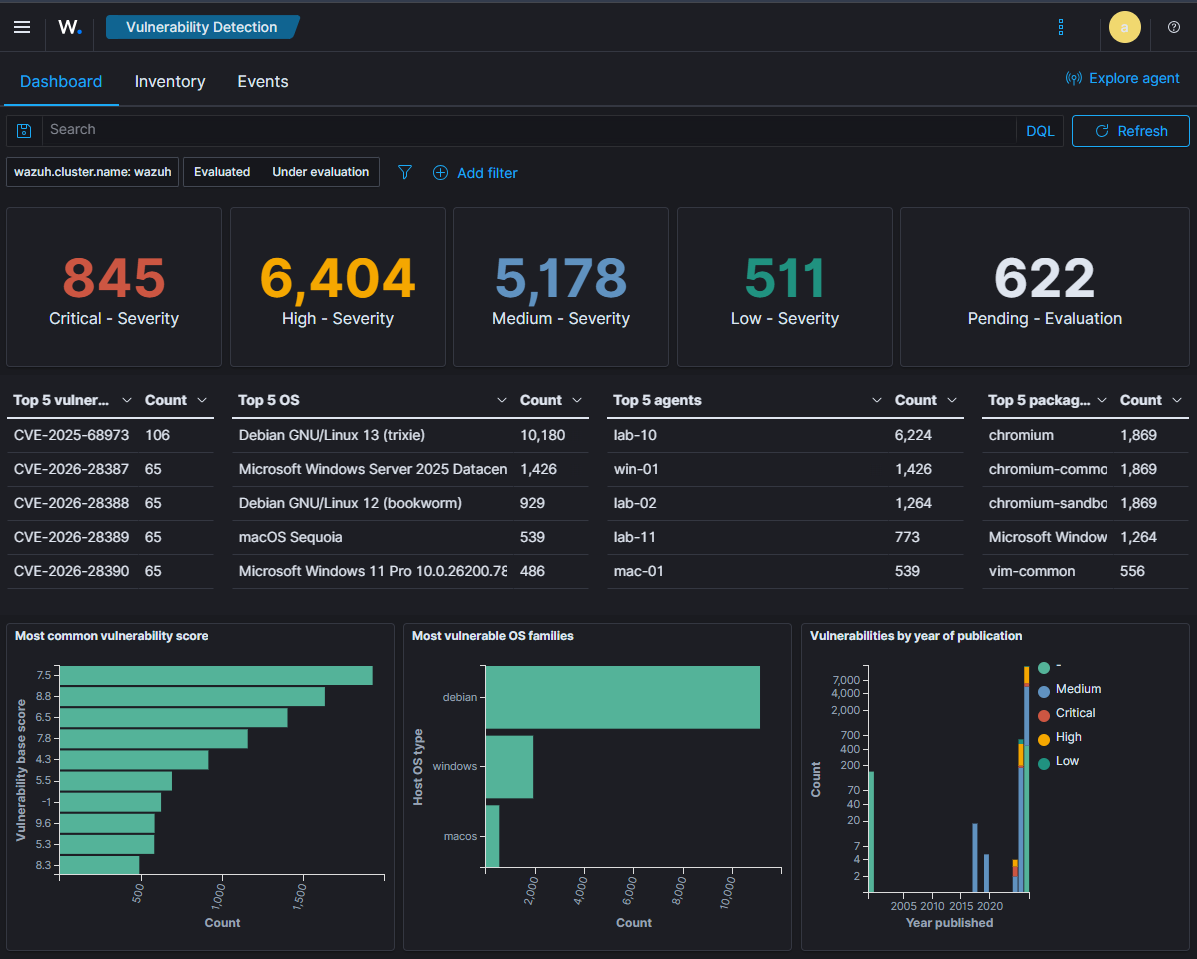
Wazuh's vulnerability detector cross-references the packages inventoried on each agent against CVE feeds, so the lab has a live, per-host view of what is actually exploitable, across Debian, Windows, and macOS. It is the same prioritization instinct as the MISP feed, pointed at installed software instead of network indicators: severity counts up top, then the specific CVEs, operating systems, and packages driving them.
What I'd tell someone starting fresh
- Spend your first week reading, not writing rules. You can't tune what you haven't baselined.
- Scope active response tighter than feels necessary. Detection false positives are noise; response false positives are outages.
- Pin your versions. The indexer and manager must match; an accidental minor-version drift between them is a bad afternoon.
- Tag ATT&CK from day one. Retrofitting technique IDs across dozens of rules is the kind of chore you'll never actually do.
What's next
- Extend CDB IOC matching to DNS and process-execution events, not just network.
- Extend vulnerability detection to the container images themselves, not just the host packages, closing the loop with the MISP CVE feed.
- Ship a curated subset of alerts to a long-term cold store for trend analysis.